
It’s no secret that the digital marketing industry moves fast. As marketers, we have to move even faster to stay competitive. The best marketers are constantly learning new marketing tactics and researching the newest trends. Please note that this list does not include any web design statistics.
There’s no better way to gain insight into the industry than evaluating the numbers. As an agency that’s focused on the Utah SEO industry, we wanted to expand our focus to the entire marketing industry as a whole.
That’s why we’ve compiled a list of fresh digital marketing statistics, covering everything from SEO and content marketing to social media and advertising. And since there’s no room for “fake news” in 2021, this list is compiled entirely from reliable studies that were conducted in the last two years.
Read on to discover over 100 cold-hard digital marketing stats that will help your business take on 2021.
Digital Marketing Statistics
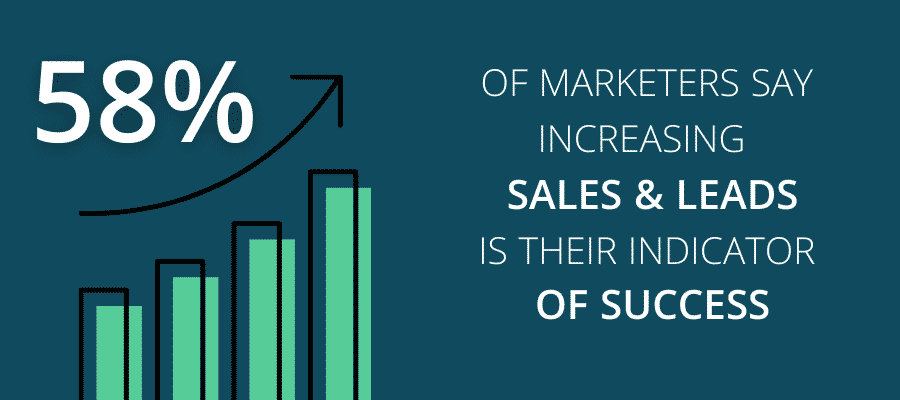
- 58% of marketers say increasing sales or bringing in leads is their most important indicator of success. (Campaign Monitor, 2018)
Strategy
- Marketers with a documented strategy are 313% more likely to report success. (CoSchedule, 2019)
- 45% of organizations don’t have a clearly defined digital marketing strategy. (Smart Insights, 2020)
- Omnichannel marketing strategies receive an average engagement rate of 18.96%, compared to 5.4% for single-channel strategies. (ClickZ, 2019)
- 78% of global direct brand marketers believe digital marketing is important to their overall marketing efforts. (Statista, 2019)
- Only 22% of marketing departments have clarity on the themes of innovation that drive growth in their company. (The House of Marketing, 2019)
- More than 70% of advertisers see their ads as relevant, but only 8% of people think the ads they see online are. (Adobe Analysis, 2018)
Investment
- Fewer than 10% of marketers plan to invest in chatbots, AI, live video, and influencer marketing in the coming year. (Campaign Monitor, 2018)
- 15% of the total digital media advertising revenue is attributed to affiliate marketing. (SaaS Scout, 2020)
- Marketing budgets represent 11.1% of firm budgets. (The CMO Survey, 2018)
Content Marketing Statistics
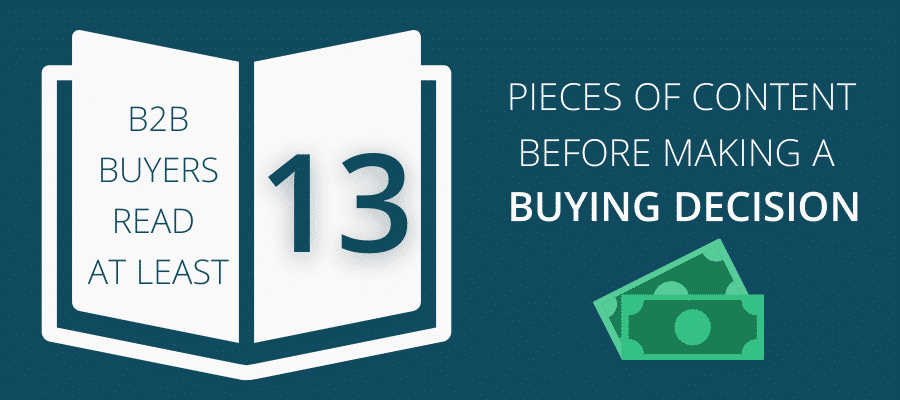
- B2B buyers read at least 13 pieces of content before making a buying decision. (FocusVision, 2020)
- 91% of marketers use content marketing, but only 9% are fully satisfied with their strategy and 38% consider it to be an average one. (SEMrush, 2020)
- Content creation is the activity B2B marketers are most likely to outsource, regardless of company size, content marketing budget, or overall content marketing success. (Content Marketing Institute, 2020)
- The top 3 types of content B2B marketers use are social media content (95%), blog posts/short articles (89%), and email newsletters (81%). (Content Marketing Institute, 2020)
- The average number of audiences B2B marketers create content for is 4. The number increases to 5 for larger companies and decreases to 3 for small companies. (Content Marketing Institute, 2020)
- Content marketers say the greatest challenges their strategy faces are creating content that generates quality leads, content that attracts more traffic, and developing content that resonates with their target audience. (SEMrush, 2020)
- 67% of content marketers cite search engine optimization as the most efficient tactic in content marketing. (SEMrush, 2020)
Blogs & Written Content
- Written content is the most prevalent type of content marketing with 86% of marketers producing blog posts, 67% sending emails, 42% publishing case studies, and 36% writing success stories. (SEMrush, 2020)
- The average cost to publish a paid guest post is $77.80. (Ahrefs, 2020)
- The average blog post takes 3 hours and 55 minutes to write. (Orbit Media, 2020)
- Updating and republishing old blog posts with new content and images can increase organic traffic by as much as 106%. (Hubspot, 2019)
- In a survey by SEMrush, 67% percent of marketers reported SEO and 51% cited updating or repurposing existing content as the most effective methods for improving content performance. (SEMrush, 2020)
Audio & Visual Content
- 60% of podcast listeners have purchased something from a podcast ad. (Midroll, 2019)
- 81% percent of listeners say the sometimes or always pay attention to podcast ads. (Midroll, 2019)
- Podcasts now reach over 100 million Americans every month, with more than one-third of Americans over the age of 12 consuming them regularly. (Edison Research, 2020)
- The number of monthly podcast consumers has grown by 16% year-over-year. (Edison Research, 2020)
- 40% of marketers cited original graphics, such as infographics, as the best performing type of visual content. (Venngage, 2020)
SEO Statistics
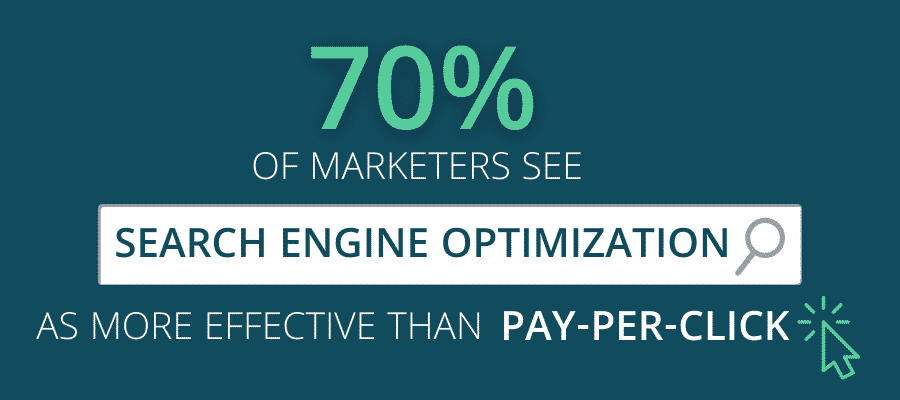
- 70% of marketers see SEO as more effective than PPC. (Databox, 2020)
- On average, small businesses spend $497.16 per month on SEO services. (Backlinko, 2019)
- B2B companies generate twice as much revenue from organic search than other channels. (BrightEdge, 2019)
- The top four ranking factors are website visits, time on site, pages per session and bounce rate. (Ranking Factors SEMrush Study 2.0, 2020)
- Articles with lists have been found to be the most shared and traffic-yielding content format, followed by guides and “how to” articles. (SEMrush, 2019)
Search Engines
- 68% of online experiences begin with a search engine. (Ahrefs, 2020)
- 15% of the billions of searches Google receives per day are entirely new queries that Google has not seen before. (Google, 2019)
- 90.63% of all web page content receives no organic traffic from Google. (Ahrefs, 2020)
- 95.88% of Google searches are four words or more. (Statista, 2020)
- Google uses over 200 unique factors to determine page rank. (Backlinko, 2020)
- The average word count of Google’s first organic page result is 2,416 words, while the 10th ranked result has an average of 2,032 words. (Sweor, 2020)
- The first result in Google’s organic search has an average CTR of 31.7%. (Backlinko, 2019)
- 53% of shoppers start their product search online before entering a physical store. (eMarketer, 2019)
Backlinks & Keywords
- 66.31% of pages don’t have a single backlink and 26.29% have links from three websites or less. (Ahrefs, 2020)
- (BrightEdge, 2019)
- 65% of domains ranking for high-volume keywords are HTTPS.(Ranking Factors SEMrush Study 2.0, 2020)
- 18% of domains ranking for high-volume keywords don’t have the keyword in the body. (Ranking Factors SEMrush Study 2.0, 2020)
- 94% of content published gets zero external links. (Backlinko, 2019)
Interactive Content
- The addition of videos to your website has the potential to increase organic search traffic by 10.6%. (Wistia, 2019)
- You’re 53% more likely to show up on the first page of Google if you have a video on your homepage. (Search Engine Watch, 2018)
Social Media Marketing Statistics
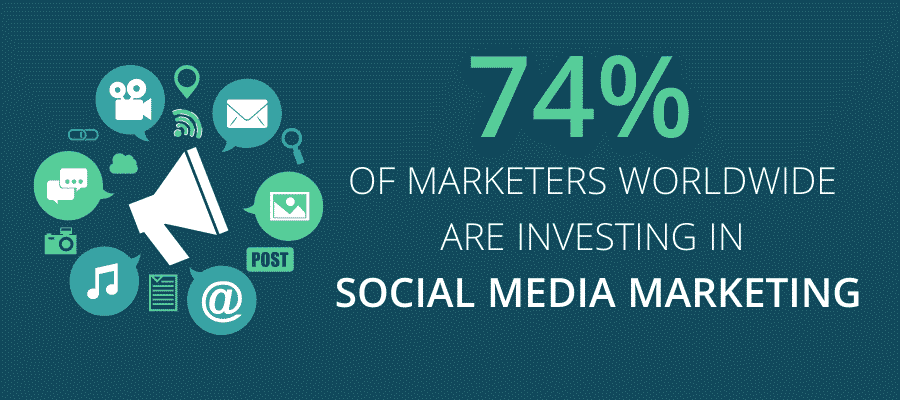
- 74% of marketers worldwide are investing in social media marketing. (Hubspot, 2020)
- Most businesses share content on social media 3-4 times per week. (Hubspot, 2020)
- 72% of B2B marketers use paid social media ads/promoted posts. (Content Marketing Institute, 2020)
- Half of Generation Z and 42% of Millennials identify social media as the most relevant channel. (Adobe Analysis, 2018)
- Non-customers are 3 times more likely to visit retailers from social media than customers. (Adobe Analysis, 2018)
- 4 in 10 internet users follow brands they like and 25% follow brands they are considering purchasing product or services from. (Global Web Index, 2019)
- 73% of consumers have been impacted by a brand’s social media presence when it comes to making a purchase decision. (Animoto, 2018)
- In Q4 of 2019, the number of influencers using #Ad in their posts exploded by 90.5%. (Social Bakers Trends Report, 2019)
Platforms
- 91% of retail brands are using at least 2 social media platforms. (OptinMonster, 2020)
- Facebook (68%) and YouTube (73%) are the most widely used online platforms among adults in the United States. (Pew Research Center, 2019)
- In 2019 LinkedIn has emerged as the most successful channel for video marketers, with an overwhelming 87% of LinkedIn video marketers describing it as an effective channel. (Wyzowl, 2020)
- 95% of B2B marketers use LinkedIn for organic content marketing. LinkedIn is also the top choice, at 76% for those who use paid social media platforms. (Content Marketing Institute, 2020)
- Roughly three-quarters of Facebook users visit the site every day. (Pew Research Center, 2019)
- 53% of people who use stories in the Facebook family of apps state that they make more purchases as a result of viewing stories. (Ispos, 2018)
- Of it’s 300 million global Monthly Active Users (MAUs) Pinterest’s users are highly active on the platform and have saved a total of more than 200 billion Pins. (Pinterest Global Analysis, 2019)
- TikTok is ignored by most marketers, with only 5% using the platform. Additionally, 74% state they have no plans to use the platform for marketing in the next year. (Social Media Examiner Industry Report, 2020)
Paid Advertising Statistics
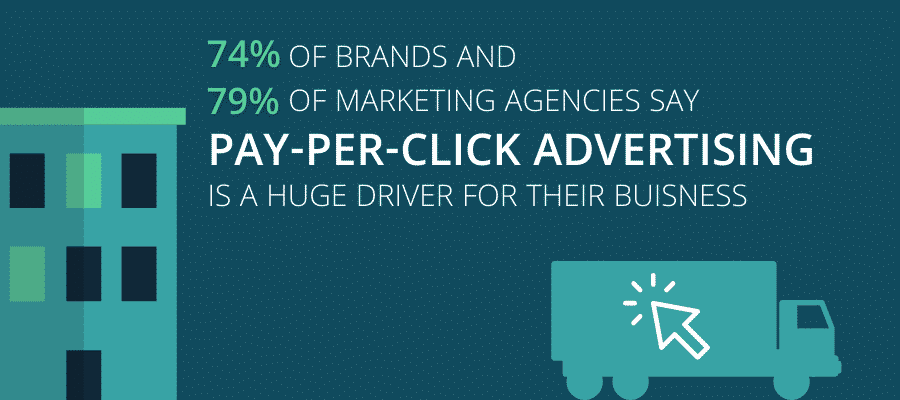
- 74% of brands and 79% of marketing agencies say that PPC advertising is a huge driver for their business. (Hanapin Marketing, 2020)
- People are most likely to click on text paid search ads with a rate of 49%, in comparison to product listing ads (31%) and video ads (16%). (Clutch 2018)
Paid Advertising Channels
- 73% of the paid search market belongs to Google. (MediaPost, 2019)
- Nearly two-thirds (66%) of brand marketers and agencies are extremely, very or moderately concerned about the oligopoly limiting their advertising options. (Factual, 2019)
- Users are 4 times as likely to click on a Google paid search ad than any other search engine, such as Amazon, YouTube, or Bing. (Clutch 2018)
- Google and Facebook still hold the largest share of total U.S. digital ad spending, with 37.2% and 22.1%. (eMarketer, 2019)
- Ad blocking in the United States has increased from 15.7% in 2014, to 27% in 2021. (Statista, 2020)
- Advertisers receive an average profit that is 8 times more than what they spend on Google Ads. (Google Economic Impact, 2019)
- The Google Display Network is able to reach 90% of internet users. (WebFX, 2019)
- The average CPC for a Google Ad is between $1 and $2 for Google search ads and less than $1 for display advertisements. (WebFX, 2020)
- More than 1.3 million businesses, website publishers, and nonprofits nationwide benefited from using Google’s advertising solutions in 2018. (Google Economic Impact Report, 2018)
- The average first page Google result contains 1,447 words. (Backlinko, 2020)
- The first result on Google has an average of 3.8 times more backlinks than positions #2-10. (Backlinko, 2020)
Automation
- 87% of marketers are using machine learning capabilities and features for bidding. (Hanapin Marketing, 2020)
- By 2020, 86.2% of all digital display ads will be bought via automated channels. (eMarketer, 2018)
Video Marketing Statistics

- 83% of video marketers say video has helped them generate leads. (Wyzowl, 2020)
- 92% of marketers who use video say that it’s an important part of their marketing strategy. (Wyzowl, 2020)
- 87% of video marketers say video has increased traffic to their website. (Wyzowl, 2020)
- Video overtakes blogs and infographics as the #1 form of media used in content strategy. (Hubspot, 2020)
- The most common types of videos are webinars, demos, and social media videos. (Vidyard, 2019)
- 54% of marketers are utilizing live videos. (Social Media Examiner Industry Report, 2020)
- Overall video ad spending is estimated to increase 62.1% before 2023. (eMarketer, 2019)
- 76% of adults and 85% of millennials have purchased a product after viewing a video. (Brightcove, 2018)
Popularity
- YouTube is the 2nd most visited website in the world. (Alexa, 2020)
- 60% of internet users are social video viewers. (Global Web Index, 2019)
- Video is consumers #1 favorite type of branded content on social media.(Animoto, 2018)
- 83% individuals aged 55-64 have watched a video clip online in the past month. (Global Web Index, 2019)
- People who watch online video spend an average of six hours and 48 minutes per week watching various types of content. (Limelight Networks, 2019)
- 68% of viewers watch a video to the end if it’s less than a minute long.(Vidyard, 2019)
- Facebook videos lasting longer than one minute were watched to completion by less than 5% of viewers. (Social Bakers Trends Report, 2019)
Email Marketing Statistics
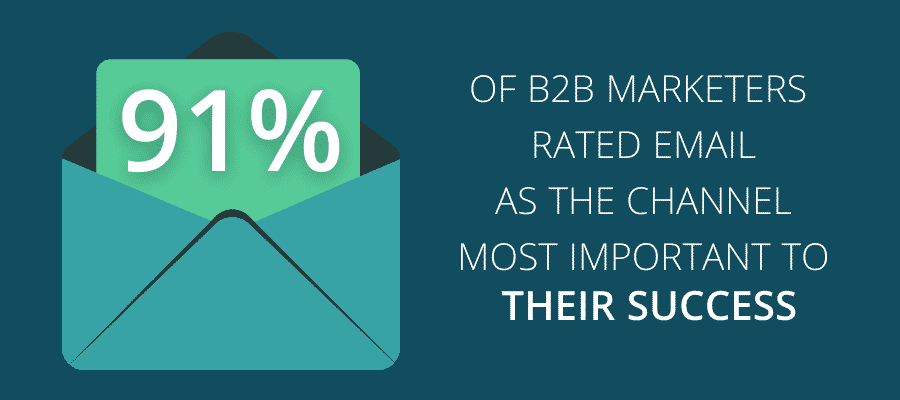
- 91% of B2B marketers rated email as the channel that was most important to their overall content marketing success. (Content Marketing Institute, 2017)
- 87% of B2B marketers rated email as their top content distribution channel (Content Marketing Institute, 2020)
- On average email marketing has a 4400% ROI. For every dollar spent on email marketing there’s potential for a $44 return. (OptinMonster, 2020)
- Triggered emails like cart abandonment emails achieve better results that the average ecommerce email – with an open rate of over 40% compared to 15%. (SaleCycle, 2018)
- As of 2020, Apple iPhone holds the largest portion of email client market share at 36% with Gmail in second at 27%. (Litmus Email Analytics, 2020)
- Only 47% of marketers are using email automation.(Emma, 2018)
Segmentation & Personalization
- 28% of marketers say that audience segmentation has improved their email engagement. (Hubspot, 2020)
- 30% of email marketers that practice list segmentation see better open rates and 24% see better email deliverability, increased sales leads, and greater revenue.(Campaign Monitor, 2018)
- 70% of marketers said their highest performing emails were sent from a person, not a brand. (Databox, 2020)
Performance
- Agencies have the lowest average email open rate of 16.10%, non-profits had the highest with an average of 36.15%. (GetResponse, 2019)
- With the exception of lunchtime, the highest email open rate occurs between 9 a.m. and 5 p.m. at 53%. (Campaign Monitor, 2019)
- Emails with a single CTA increased clicks 371% and sales 1617% in a case study by Marketing at Toast. (WordStream, 2019)
- Government related emails have the highest open rates, with a rate of 28.77%. (Mailchimp, 2019)