
If you have an e-commerce store, chances are you’re swimming in data. In e-commerce, your customer data is the most valuable asset your brand owns. What you do with this data determines whether your brand is thriving or trying to survive because most brands don’t know how to get the most out of their customer data in terms of insights and actions. Many brands rely solely on Google Analytics and the information that Shopify gives them about their customers to make marketing decisions. While this is a good starting point, you need to dig deeper.
Whether you like it or not, consumers want personalized marketing and a personalized shopping experience (thanks Amazon!) and you need to adapt to survive. Tackling personalization can be tough, but the best way to do this is to segment your customer list and treat each of your customer segments differently based on where they are in their customer journey. But don’t just segment your customers based on demographic data, segment based on purchase behavior. In this guide, you’ll learn what RFM Analysis is and how you can use it to develop personalized marketing strategies that will grow your brand.
What is RFM Analysis?
RFM Analysis stands for Recency, Frequency, Monetary (Value) Analysis. What was originally developed as a method for businesses to get the best bang for their buck with their direct mail marketing is now being used by e-commerce brands to maximize revenue from existing customers with retention marketing strategies.
RFM Analysis can help you improve your marketing by making it easy for you segment your customer list according to their individual purchase behavior to better target them with personalized marketing.
Recency
Recency measures how recently someone made their last purchase with you.
Frequency
Frequency is how many times they have made a purchase from your brand over the span of any given timeframe.
Monetary
Monetary is the measure of how much money they spend with your brand over a given period of time. This involves looking into their Average Order Value (AOV).
Why is RFM Analysis important?
Utilizing RFM Analysis allows you look deeper into your data to better understand your customers’ purchase behavior. When you’re able to analyze this data, you can then start optimizing for one the most important e-commerce KPIs: Customer Lifetime Value (CLV).
With RFM Analysis, you can segment your customers based on their purchase behavior. This allows you to personalize your marketing and shift your focus to providing additional value to your highest value customers, boosting your CLV.
The reality is that there are subsets of your customers that need to be treated and/or marketed to differently in order for them to purchase from your brand more frequently and to spend more with your store. Segmenting your customers using RFM Analysis allows you to identify opportunities that can lead to maximizing your CLV.
How To Approach RFM Marketing
Having access to RFM data can give you significant insight into how your customers buy from your brand. You can then use this data to identify opportunities to change the purchasing behavior of your customers. Below, we’ll walk you through how to approach RFM Analysis on your own.
Segmenting Your Customers
To create your customer segments based on RFM, you need to first need to assign a score based on each category: Recency, Frequency, and Monetary. Each category will receive a number between 1-5, and these numbers are based on rules you set to determine the score. It can be confusing at first, so we will provide an example of this process with fake data to help you better understand the scoring process and RFM segmentation.
Scoring Each Category
Below, we will provide an example of how we would score each category for an imaginary brand. Using fake data, this is how we would determine who gets what score:
Recency
Recency measures how recently a customer made their last purchase. For this, you want to segment based on when someone made their last purchase. Here’s how we segment it for our fake data:
| Days Since Last Purchase | Score |
| 91+ | 1 |
| 51-90 | 2 |
| 31-50 | 3 |
| 11-30 | 4 |
| 0-10 | 5 |
Frequency
The scoring for Frequency is based on the customers’ purchase frequency, which should be based on the span of a year. This is how it would look:
| Purchases in a Year | Score |
| 1-2 | 1 |
| 3-4 | 2 |
| 5-6 | 3 |
| 7-8 | 4 |
| 9+ | 5 |
Monetary
For scoring Monetary value, you want to segment based on how much a customer has spent. This should be based on the same date range as Frequency. This is how it would look:
| Revenue Generated | Score |
| $1 – $50 | 1 |
| $51 – $75 | 2 |
| $76 – $150 | 3 |
| $151 – $200 | 4 |
| $200+ | 5 |
With the three categories above, we can now assign RFM scores to each individual customer. Here’s what that would look like:
If a customer:
- Last made a purchase between 11-30 days
- Purchases on average 3-4 times per year
- Generates over $200 in revenue in a year
Then that customer would receive an RFM score of (4,2,5)
It’s important to note that how you score each of these categories will depend on your brand. There are different ways to do it, but the best way to categorize the scoring is by using a distribution model to accurately represent your data – meaning that your “average” score should be 3 if you’re using a 5-point scoring system.
Common Customer RFM Segments
Now that you understand the scoring, you can then assign each score to customers and create segments that capture each group of customers. It’s important that you know how to properly segment your customer base so you can make the most of your data.
To start, you first need to pick a timeframe of data that you are going to analyze. To get the best results with this segmentation, you’re going to need your historical data, which needs to be at least a few years’ worth of data, then pick a period of time of which you would like to analyze. It’s best practice to look at year, unless your brand has been around for 50+ years, then it might be best to look at 5-year increments.
The reason for this is because it’s important to look at the average lifespan of a customer segment. You need historical data to actually see the average lifetime of a customer. Then, when you look at a year’s worth of data, you would be able to calculate CLV for each segment if you wanted to (this is something that we highly recommend doing).
You can segment your customers however you’d like to, but we’ll cover some common RFM segments that we use for our clients below.
Ex-Lovers
Ex-Lovers are customers who used to be loyal customers who were high value, but no longer are because they haven’t purchased from you in a long time. This segment has likely moved on from your brand because they no longer need your products, or they were won over by your competitors.
For this segment, the Recency score would be 1, and for Frequency and Monetary, the score would be 4 or 5.
Lovers
Lovers are active customers who are high-value and frequent purchasers, but are not quite your most valuable.
This segment would be below a score of (5,5,5), but each individual score being 4 or 5. For example, the scoring might look like (4,4,4) or (5,4,5).
Soulmates
Your Soulmates are going to be your most valued customers whose CLV is exceptionally higher than the rest of your customer base. The RFM score for this segment is (5,5,5)
About to Dump You
The About to Dump You segment is your customers who haven’t purchased from you in a while and that you are at risk of losing. Because this segment hasn’t quite abandoned you yet, this segment will be defined by having a Recency score of 2.
Don Juan
Your Don Juan segment is going to be customers who spent a lot of money with you, but has only made one purchase. This segment is important to keep track of because it shows you customers with a high AOV. Although this segment may have only purchased one time, they have high potential if you can bring them back for more purchases.
The scoring for this segment has a Frequency and Recency score of 1, but a Monetary score of 4 or 5.
Apprentice
The Apprentice segment consists of your new customers who have recently purchased from you and spent an average or below average amount of money on their transaction.
This segment would have a Recency score of 5, a Frequency score of 1, and a Monetary score of 3 or lower.
How to Implement the Segmentation
Once you assign scores to each RFM category and create your segments, it’s time to actually implement this data and make it usable. An easy way to do this is by using Microsoft Excel.
Step 1: Prepare Your Data
The first step in this process is to export all of your customer data. This should include the number of transactions, how much they spend on each transaction, and the dates of each transaction.
Step 2: Score Your Customers
Next, you will need to score and segment your customers. You want to start off by creating a table that looks like this:
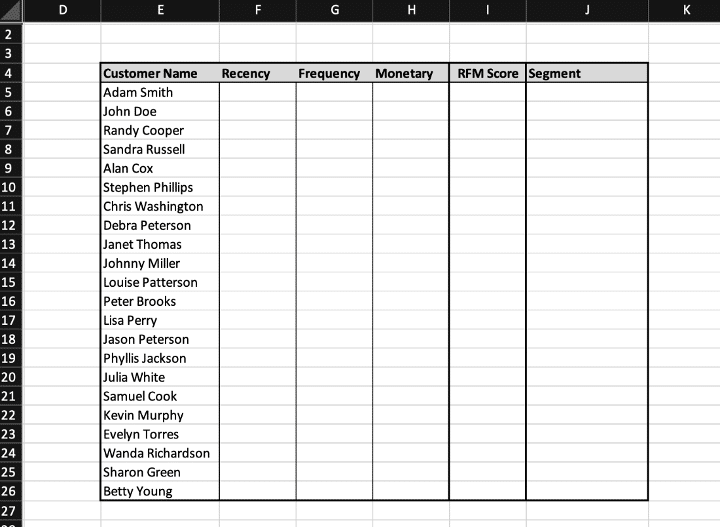
In the blank cells, enter all three RFM scores for each customer based on their purchasing behavior. You can use formulas to calculate this automatically if you’d like.
The “RFM Score” column combines the three individual scores so you can filter your data by certain combinations of scores.
The “Segment” column assigns a segment to that customer based on what the RFM score is. For example, if a customer scores (5,5,5), they will be assigned to the Soulmate segment (your highest valued customer segment).
Once the data is filled out, it will look something like this:
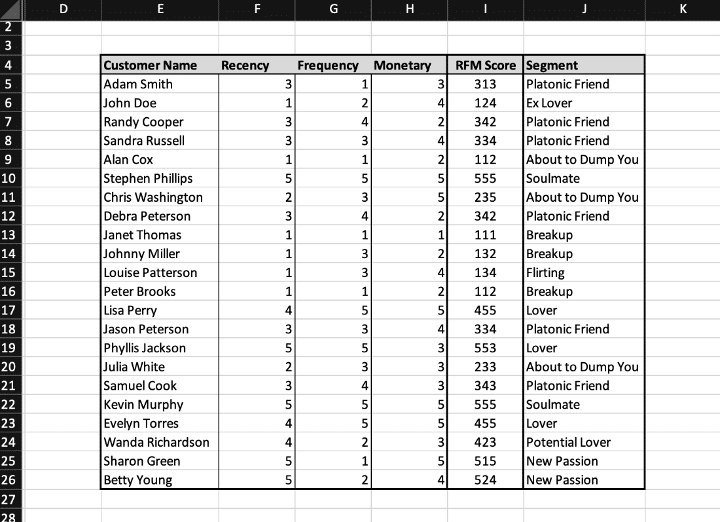
Sort and Filter Your Data
Now that each customer is assigned a score, you can now filter your data based on the customer segment you want to look at.
What you can do is add a filter so only customers from certain segments show up. Once you have your customer list, you can now start to implement your RFM-based marketing strategies. Here’s an example of how you could do this:
Let’s say you want to send an email to your most loyal customers to show them your appreciation by sending them a gift card to your store. You can apply a filter so that only your Soulmate segment appears. Then, you can export the customer data for that segment and send the email campaign to them. We highly recommend segmenting your email list with your RFM segments using a tool like Klaviyo.
RFM Marketing Strategies
When you have access to the type of data that RFM segmentation reveals, the possibilities are endless. There isn’t a single way to approach this, it really just depends on what the data is telling you. There are a number of things that can be applied to your marketing strategy through this sort of analysis. Many will be unique to each brand and each situation, but there are some common practices that can be done universally among almost all brands.
Customer Research
Knowing who your best customers are gives you a huge advantage in e-commerce. RFM Analysis allows you to see who these customers are, which you can then use to your advantage. While this data doesn’t tell you why they’re your best customers, you can use your data to send them specialized surveys so you can better understand them on a much deeper level. Instead of just looking for surface-level demographics, you want to see what other attributes they may have in common. It could be something like an occupation that separates them from the rest of your customers. If you effectively survey them, you may be able to find something out that you wouldn’t have otherwise known. This can reveal valuable information and help you shift your marketing efforts to target the right audience.
Another great way to get some solid insights about your customers is to interview them. Doing this for your highest value customers could allow you to uncover things about your customers that you wouldn’t otherwise know. Ask your customers why they buy from you, which products they love, which products they don’t, what problems your product(s) solve for them, etc.
Segment Distribution
The first thing you can do when analyzing RFM data is look at the distribution of your customers. Identify what your largest segment is and your smallest segment is and determine whether or not this is a good or bad thing. For example, if you were to find that 30% of your customers were in the “About to Dump You Segment” or “Ex-Lover” segment, this would indicate that you need to shift your focus to these customer segments to make them feel appreciated by providing them with additional value.
Email Marketing
When it comes to email marketing, one mistake many e-commerce brands make is sending all customers the same promotional emails, but going about this approach can be very ineffective. If you change your messaging instead, depending on who it is you are talking to, you’ll find that your email campaigns will harvest better results. If you have a promotional email going on, find customers that are about to leave you and give them a better offer to increase their likelihood of coming back.
RFM Data and Acquisition and Remarketing
RFM Analysis is great for customer retention, which is what most brands who practice this type of data collection use it for; however, it can be extremely effective for acquisition as well. When you collect this customer data, you can use it to create Lookalike Audiences on Meta’s platforms. Chances are that your most valuable customers have certain attributes in common, whether it be demographics or behavioral patterns. Either way, Meta is very good at picking up on this and will be more efficient at gaining you better customers than if you were to just shoot in the dark.
Learn more about RFM Analysis to scale your online store on Ranksey’s e-commerce podcast, “E-Commerce Secrets to Scale”.
Get Help With RFM Analysis
RFM Analysis is a very important tool that you can use to increase your CLV. If you properly plan out your marketing strategies around this data, it can have a huge impact on your brand’s revenue. Because RFM Analysis is so subjective, it’s really tough to provide clear, step-by-step instructions within an article. If you’re interested in increasing your CLV, you can request a free audit of your CLV today.